Upper limb of an Expanding Size Range?
|
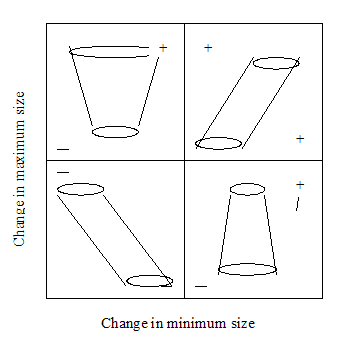
While Arnold et al. (1995) believe that there is a observational basis for Cope’s rule, Jablonski (1997) does not agree with the rule at all. In his paper, Jablonski (1997) proposes that what is being observed as Cope’s rule is simply the upper limb of an expanding size range (increasing variance, although not in the statistical sense). To test this hypothesis, Jablonski (1997) used all 191 lineages of Cretaceous molluscs to determine the size of the largest specimen at the beginning and end of each study interval. The data points were plotted as a change in minimum size against a change in maximum size over a period of 16Myr (Figure 4)(Jablonski, 1997). The four quadrants represented four possible trends in |
 |
 |
Figure 4. Graphic representation of the four possible evolutionary trends which may be followed by the Cretaceous molluscs, over a time period from t1(bottom) to t2(top). Points can be plotted from each clade as the maximum recorded size of the largest and smallest species. The top right corner is Cope’s rule, bottom right a decrease in size, top left an increase in variance and bottom left a decrease in variance. (after Jablonski, 1997). |
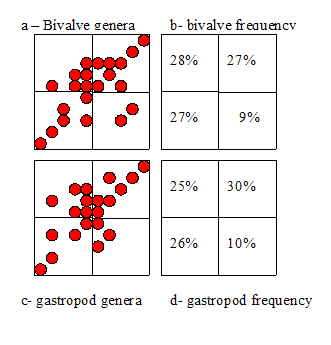
body size evolution. The results were split between bivalves and gastropods and similar results were found (Figure 5). In both cases the proportion of species with size increase (27-30%), size decrease (26-26%) and increase in size range (25-28%) were significantly equal (Jablonski, 1997). One bias of this technique that was pointed out by Jablonski was that the points along the diagonal from the lower left to upper right corner was an artefact of the technique used |
| Figure 5. Trends in evolution of size in bivalves (a,b) and gastropods ( c,d) over 16Mya. All size increases have been log2 transformed. (after Jablonski, 1997) |
| and that these points represent individuals who are both the largest and smallest in their time interval. When these points were omitted, the increased variance quadrant had the highest proportion of points (39% of bivalves and 40% of gastropods) whereas the size increase and size decrease quadrants still had statistically equal proportions (Jablonski, 1997). These results dismiss Cope’s rule and show that it is equally likely for size increase to occur as it is for size decrease (Jablonski, 1997). The apparent net body size increase is thought to be observed due to an increase in size range instead (Jablonski, 1997). |
| |

